Diffraction Grating versus Prism
Linear Versus Non-linear Spectra
This webpage contains images and explanations that also appear on two other webpages of mine, but in those webpages they are a limited part of a more expansive topic. I have assembled both pairs of images here in an effort to better unify the information about the linearity versus the non-linearity of spectra. All images on this webpage were made with the same camera: a Canon T4i digital single lens reflex camera. For information concerning the specifics of these image pairs, see the following webpages: lightning spectra for the first and spectral types (Spectral Classification of Stars) for the second.
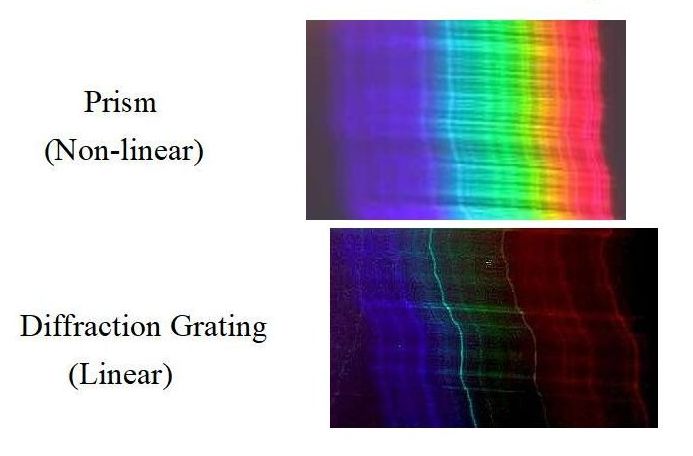
Lightning Spectra
The image below shows a comparison of a scaled portion of lightning spectra. The upper spectrum on the image was made with a prism and is non-linear in the wavelength (color) dimension along the bottom of the image, whereas the lower spectrum was made with a transmission diffraction grating and is linear in the wavelength dimension. Although the same emission lines appear on both spectra, they don't match throughout due to the differences between the linear and a non-linear representations. Relative to the linear representation, the non-linear expands the blue end and contracts the red end.
Spectral Classification of Stars (and Sun)
The two spectra below are both of G spectral class stars: the upper one is of the Sun (a G2 star) and the one beneath it is of the bright star Capella (a G8 star). Both images were made with my Canon T4i digital camera. I made the solar spectrum with my homemade solar spectrograph, which uses a commercial mirrored diffraction grating that I obtained from eBay, so its spectrum is linear, or very nearly linear. I made the one beneath with my homemade prism star spectrograph, so its spectrum is distinctly non-linear. The differences between these two spectra are due primarily to the differences in the linearity and non-linearity of the instrumental responses rather than the slight differences in their spectral types.
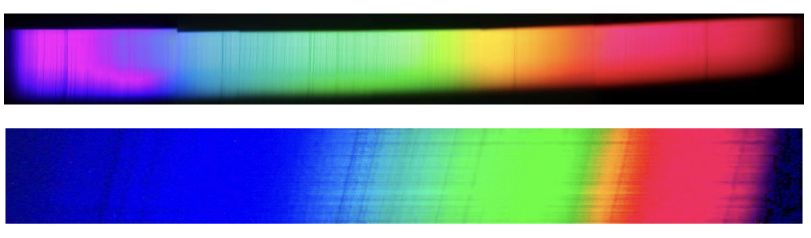
Relative to the upper linear solar spectrum, the lower non-linear stellar spectrum expands the blue end (left) of the spectrum and contracts the red end (right). Absorption lines present in both spectra are likewise displaced.
For additional images that illustrate the differences of portraying optical spectra in a linear vs non-linear portrayal, see the following links:
gemscientist.com/Gemscientist/Blog/Entries/2010/6/17_What_spectroscope_is_right_for_you.html
.
users.humboldt.edu/rpaselk/C438L.F00/LabLecNotes/Spectroscopy/GrtPrzmSpctrm.jpg
.